
Electricity Maps
NOMINEE OVERVIEW
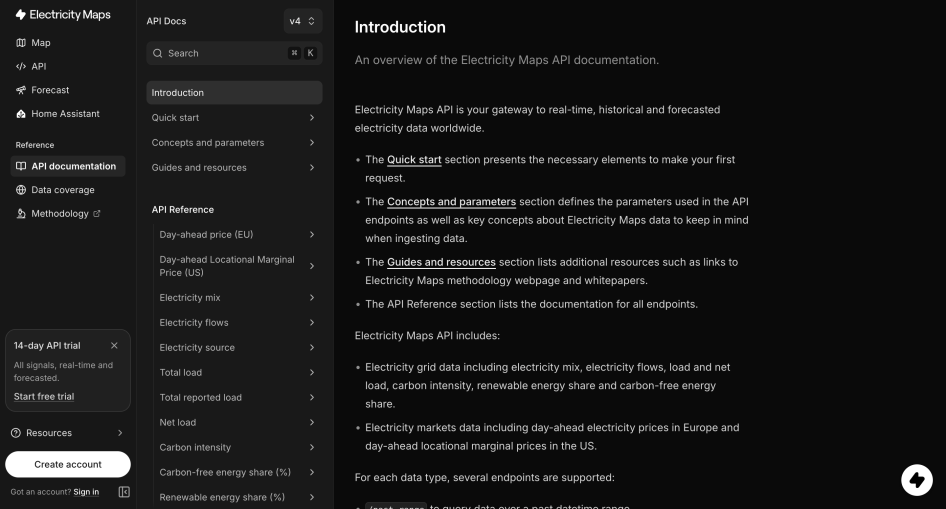
Electricity Maps API Docs are the entry point to real-time, historical, and forecasted electricity data worldwide. The API covers grid signals (electricity mix, cross-border flows, total and net load, carbon intensity, renewable and carbon-free share) and market signals (day-ahead prices in Europe and day-ahead locational marginal prices in the US). Every signal follows the same pattern of latest, history, past, past-range, and forecast endpoints. For prices, a combined endpoint extends published prices with Electricity Maps' proprietary forecasts.
Grid data is only valuable if people can interpret it correctly, so the docs treat understanding as seriously as access. A dedicated Concepts section explains flow-tracing (how imports and exports shape a grid's mix), direct versus life-cycle emission factors, temporal granularity, and how load and net load are defined. Transparency is built into the data itself: every response flags whether a value is estimated and which model produced it, and users can switch estimations off entirely. The docs link straight to the full public methodology and a data coverage explorer, and a 14-day trial lets developers test every signal before committing.
NOMINATION RATIONALE
1) BEST DEVELOPER PORTAL FOR API DATA PRODUCTS
Why is this category a strong match?
Our API serves electricity grid and market data, where the hard part is rarely getting a number. The hard part is knowing what that number means. A carbon intensity value changes depending on whether it accounts for imported electricity, whether it uses direct or life-cycle emission factors, and whether it was measured or estimated. Two users can call the same endpoint and draw opposite conclusions if they don't understand those choices. The portal is designed around that problem: it makes the assumptions behind every value visible, explains them in plain language, and lets users change them explicitly.
In what ways does your portal shine in this category?
Every response explains itself. Responses don't return a bare value. They also return the context needed to interpret it: which emission factor type was applied, whether the value is flow-traced (consumption-based) or generation-only, its temporal granularity, whether it is estimated, and which estimation model produced it. Downstream systems can store and audit these flags alongside the data.
Methodology choices are parameters, not fine print. Users switch between direct and life-cycle emission factors (emissionFactorType), between consumption-based and generation-only values (flowTraced), and can exclude estimated data points entirely (disableEstimations). Defaults are shown on every endpoint, so nobody inherits an assumption without seeing it.
Concepts come before endpoints. A dedicated Concepts and parameters section explains flow-tracing, emission factors, estimations, temporal granularity, data availability, and how load and net load are defined. Each page links onward to the full public methodology.
Coverage is explorable. A data coverage explorer shows which signals are available for which regions and time periods, so users can confirm the data fits their use case before integrating.
One consistent shape across every signal. Grid signals (mix, flows, load, carbon intensity, renewable and carbon-free share) and market signals (EU day-ahead prices, US day-ahead LMPs) share the same latest / history / past / past-range / forecast pattern. Learning one signal means learning them all.